Netify Firewall Agent
Netify Console
The data from the underlying open source Netify DPI Engine can be used by third party developers to create all sorts of on-premise tools. The Netify Console is just one example! The console tool is only available for ClearOS at the moment - you can find the install instructions in this blog post. The documentation for Netify Console is below.
Description
The Netify Console is an ncurses-based PHP application that connects to a local or remote Netify Agent to display real-time status and flow information.
Synopsis
netify-console [-n NODE] [-s SERVICE]
Options
-n NODE
Specify the node name to connect to. This can be either an IPv4/6 IP address, a hostname, or a local UNIX socket path.
-s SERVICE
For an IP-based NODE, this is the numeric port or service name to connect to. For UNIX socket paths, this option is not required and thus ignored.
Overview
The main window is split into three panes; a title header and status footer which are each one line in height. The largest pane in the middle displays flows and messages. The header contains version information and the NODE/SERVICE of the connected Agent. The footer contains Console and Agent status information. Currently the number of flows, memory usage, and uptime are displayed.
A flow entry has the following format:
engd ens34 ec1eeaa TCP4 SSL gmail gw-ens34:32776 > 172.217.12.197:443
Here is a screenshot:
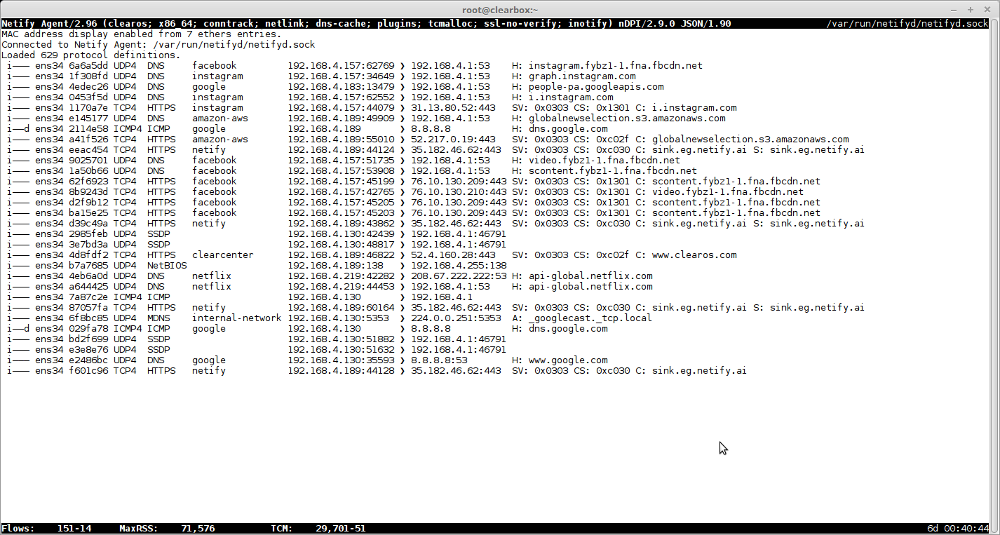
Each entry is comprised of at least nine columns which are described below.
1. Flow flags
These flags provide high-level details about how the flow was captured and the quality of the DPI classification.
- The first flag can be either an "i" for flows captured from an internal (LAN) interface, or "e" for flows captured from an external (WAN) interface.
- The second flag may only be set to "n" for flows captured from an external interface that were found in the connection tracking (NAT) table.
- The third flag, when set to "g", indicates that the DPI engine took a guess about the detected protocol based solely on the flow's TCP or UDP port(s). This is a non-DPI classification which should be interpreted with less confidence.
- The fourth and last flag indicates with a "d" whether application detection was assisted by a hint from the DNS cache. This is generally quite reliable but there are rare instances when this information can be inaccurate and thus should be interpreted with more scrutiny.
2. Interface
The interface column display the interface name the flow was captured from.
3. Flow digest
The metadata for each flow is hashed via SHA1 to provide a unique fingerprint. The first seven hexadecimal digits of this digest are displayed in the third column.
4. IP protocol and version
The IP protocol from the IP header. The protocol name is suffixed with the IP version, 4 or 6.
5. Detected protocol
This is the detected protocol via DPI. If no detection was make, "Unknown" is displayed.
6. Detected application
An application (service) is derived from metrics such as DNS/MDNS look-ups, SSL SNI/certificates (common name), HTTP headers (host), etc. A search is performed for these text strings that are mapped to an application name. Examples include: google, gmail, facebook, snapchat, android, etc.
7. Source address
The source address indicates the flow origin. The address can be a combination of address and port (for protocols with ports). The address can be an IP address or MAC address depending on the display mode. MAC addresses are only displayed as human-readable string if an entry is found in ethers(5).
8. Destination address
The destination address indicates the flow destination. The address can be a combination of address and port (for protocols with ports). The address can be an IP address or MAC address depending on the display mode. MAC addresses are only displayed as human-readable string if an entry is found in ethers(5).
9. DPI metadata
The last column, which may extend past the width of the terminal, contains protocol-specific information. For example, a DNS request will display the hostname, an SSL flow will display (when available) the SNI or common names from certificates. Each protocol may include addi‐ tional information that will be presented here.
Keymap
Various keys are mapped to certain functions of the Console.
- i Toggle the display of flows from internal (LAN) interfaces on or off.
- e Toggle the display of flows from external (WAN) interfaces on or off.
- n Toggle the display of external flows that were found in the connection tracking (NAT) table.
- N Toggle the display of external NAT flows and when enabled, disable the display of external non-NAT flows. This mode hides external connections that originate from the gateway/router itself.
- a Toggle the display of IP addresses or MAC address names. In MAC address display mode, if a MAC address is not found in ethers(5), the IP address will be displayed. The default mode is to display MAC addresses when available from ethers(5).
- d Perform reverse DNS lookups on local and remote IP addresses. If a hostname is found, the domain plus the first two subdomains are displayed. For example, xyz.123.domain.com becomes 123.domain.com.
- h Help. Display this manual page.
- q Quit Netify Console.
Netify Agent
Inputs
Processor Plugins
Output Plugins
Output Formats
Other Links
Integration and Custom Solutions
Do you have any questions about integration, APIs or custom development?
Contact Us