Getting Started
Getting Started
API Server
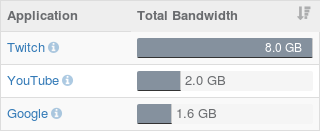
Let's dive into the Netify Informatics API by going though an example step-by-step. Our Getting Started example is going to give you the top applications by download bandwidth - the same data used to create the widget in the adjacent screenshot. First thing is first: fire up Postman or your favorite tool for poking around RESTful APIs.
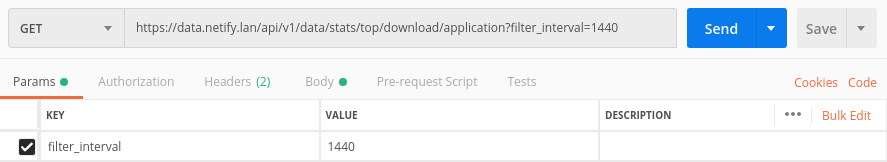
With your REST API tool in hand, copy and paste the endpoint into your preferred tool:
https://informatics.netify.ai/api/v1/data/stats/top/application/downloadSince this API endpoint requires authentication, you won't get very far! You will see a standard 403: Access Forbidden response from the API server. While exploring the Netify Informatics API, you may need to reference the response codes documentation.
On to the next section: Authentication.
Authentication
Netify Informatics API endpoints require authentication and authorization. Like most RESTful APIs, this layer is handled via HTTP request headers.
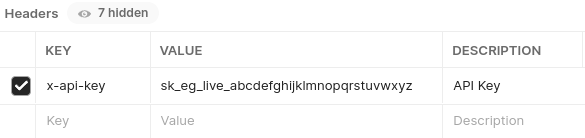
For integrators who use Netify for internal products and centrally-managed systems, you will be provided with an API key to access the data. To authenticate an API request, send the x-api-key in the HTTP header.
For non-integrators, or if you wish to access the public live demo data in our Getting Started example, you will only need the x-net-uuid identification key to access network data. Set the x-net-uuid value to NE-TI-FY-99 in your headers to gain access - here's what it looks like in Postman:
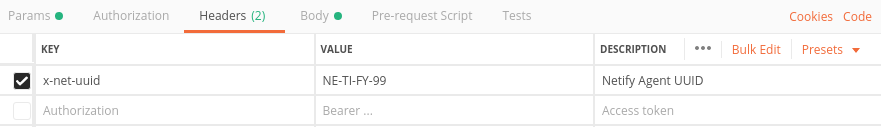
The authentication that is typically handled via an API key/token (e.g. x-api-key) has been disabled for our demo. That's all we'll need for now, but you can find details about authentication and authorization here.
Response Payload
With authentication out of the way, we can now start slicing and dicing the network data. You should see a familiar looking JSON response payload like the one shown in the sidebar/below. Here's the breakdown of the payload.
Status Information
Standard HTTP response codes are sent by the API, along with the following status information (if available):
- status_code: a status code number
- status_message: a human-readable status message
- status_fields: an array of validation errors (if any)
Metadata Information
Metadata information is provided in the data_info object.
Data Payload
The data object contains the data that we want - the top applications by bandwidth consumption. The bandwidth totals are in bytes, but later on you will see how to turn that into an average bandwidth speed.
{
    "status_code": 0,
    "status_message": "Success.",
    "data_info": {
        "total_records": 10
    },
    "data": [
        {
            "application": {
                "id": 195,
                "label": "Twitch"
            },
            "download": 8221201158
        },
        {
            "application": {
                "id": 124,
                "label": "YouTube"
            },
            "download": 2135346252
        },
        ...
    ]
}
Timespan and Filters
The Netify Informatics API provides some powerful filtering tools too drill down into your data. Here's the full list of Data Filters, but we'll step through a couple of examples here.
Arguably the most important filters handle data timespans. By default, time-based data from the API will return information in the last 30 minutes. You can use the filter_interval parameter to specify a larger timespan (in minutes). If you want the bandwidth data for the last day (1440 minutes), use a standard GET request in your resource URL: ?filter_interval=1440
You can also specify a specific timespan using the filter_start_date and filter_end_date (see Data Filters).
Settings
In addition to filtering data, you can also format the data output using some handy Data Settings. Here are some quick examples.
Record Limits
By default, the API will return the default top 10 bandwidth consumers. You can change this limit by setting the settings_limit parameter to a different value.
{endpoint}?settings_limit=3Bandwidth Format
If you want to change the returned bandwidth from totals (in bytes) to bandwidth speeds (in bytes per second), set the settings_stats_format to rate. Note: bandwidth is returned in bytes per second.
Fields
We're just about finished! This Getting Started example shows top application downloaders flowing on the network. However, that's not the only field available. You can also group data by:
- Protocols
- IP
- Owners
- Device Types
- Countries
- and many more
Informatics Docs
Integration and Custom Solutions
Do you have any questions about integration, APIs or custom development?
Contact Us