Core Processor
Netify Core Processor Plugin
Introduction
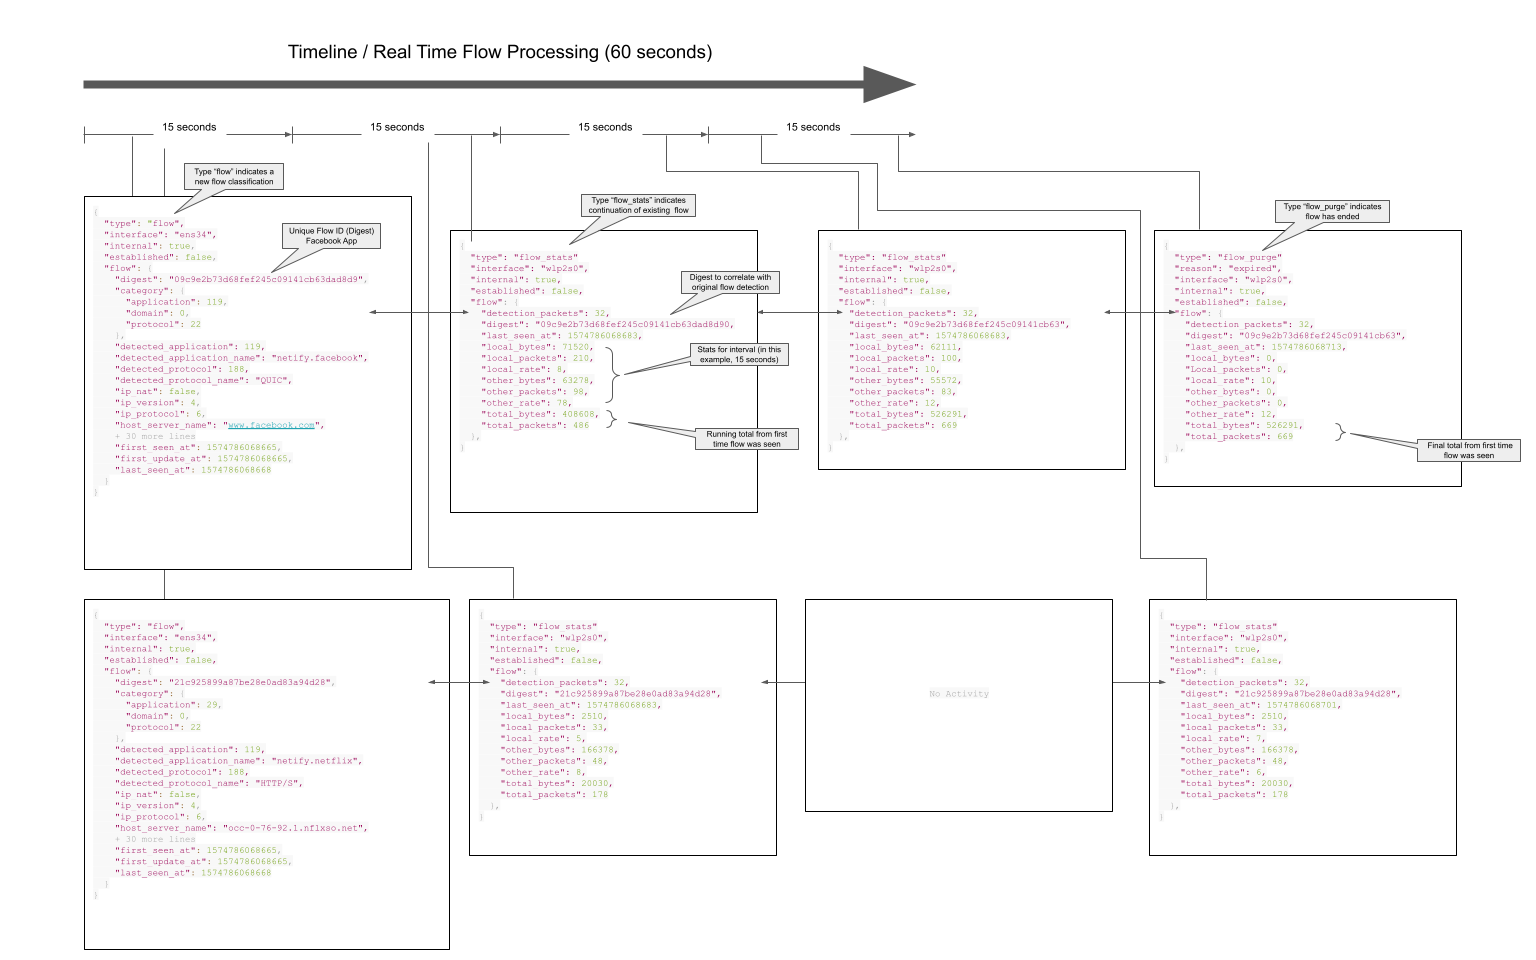
The Core Processor plugin is responsible for creating structured data objects from the internals of the Netify Agent's memory and triggered by an event framework. The following events are supported:
- flow A 'flow' event is triggered every time a new flow is detected. Flows are unique groupings of packets that make up a TCP connection or a UDP stream - basically any Layer 3 or 4 protocols.
- flow_stat A 'flow_stat' event is triggered on a set interval. The interval default is 15 seconds, but is configurable. Every 'tick' triggers a summary of statistical data to be created for every active flow that has been seen in the last interval window.
- flow_purge A 'flow_purge' event is triggered on the same set interval as the flow_stat event. Flow purge events notify the consumer of every flow that is being purged from memory. That could happen because a TCP connection has closed (FIN detected) or a flow TTL expires. For TCP flows this is NN minutes and for UDP it is NN minutes. These settings are also configurable.
- flow_dpi_complete A 'flow_dpi_complete' event is not generally for human interest, but can be used programmatically to trigger additional actions upstream in code.
- detection_updated A 'detection_updated' event is similar to flow_dpi_complete, but indicates an update occurred, not an initial classification.
The diagram below illustrates when these events are created along with their relation to each other.
License
The Netify Core Processor Plugin is open-source software. It can be dual-licensed under the GPLv3 or a commercial license. Please contact us for details.
Installation
Netify plugins are packaged in the same workflow as the agent and can usually be installed using a similar syntax that was implemented during the installation of the Netify agent. Exceptions to this rule occur when the plugin requires a Software License Agreement or if an upgrade or downgrade to a different version of the plugin is required.
Alma Linux
Alma Linux 9
Assuming you have installed the Netify repository during the Netify Agent installation, you can install the Netify Core Processor by running:
yum update
yum install netify-proc-core
To install a package manually, you can find the version you wish to install from our download servers and install it as you would any other package. For example:
cd /tmp/
wget https://download.netify.ai/5/almalinux/9/stable/x86_64/netify-proc-core_1.0.58-1.os9.x86_64.rpm
yum install ./netify-proc-core_1.0.58-1.os9.x86_64.rpm
Alma Linux 8
Assuming you have installed the Netify repository during the Netify Agent installation, you can install the Netify Core Processor by running:
yum update
yum install netify-proc-core
To install a package manually, you can find the version you wish to install from our download servers and install it as you would any other package. For example:
cd /tmp/
wget https://download.netify.ai/5/almalinux/8/stable/x86_64/netify-proc-core_1.0.58-1.os8.x86_64.rpm
yum install ./netify-proc-core_1.0.58-1.os8.x86_64.rpm
Debian
Debian 13 (Bookworm)
Assuming you have installed the Netify repository during the Netify Agent installation, you can install the Netify Core Processor by running:
apt update
apt install netify-proc-core
To install a package manually, you can find the version you wish to install from our download servers and install it as you would any other package. For example:
cd /tmp/
wget https://download.netify.ai/5/debian/12/amd64/netify-proc-core_1.0.58-1_amd64.deb
apt install ./netify-proc-core_1.0.58-1_amd64.deb
Debian 11 (Bullseye)
Assuming you have installed the Netify repository during the Netify Agent installation, you can install the Netify Core Processor by running:
apt update
apt install netify-proc-core
To install a package manually, you can find the version you wish to install from our download servers and install it as you would any other package. For example:
cd /tmp/
wget https://download.netify.ai/5/debian/11/amd64/netify-proc-core_1.0.58-1_amd64.deb
apt install ./netify-proc-core_1.0.58-1_amd64.deb
Debian 10 (Buster)
Assuming you have installed the Netify repository during the Netify Agent installation, you can install the Netify Core Processor by running:
apt update
apt install netify-proc-core
To install a package manually, you can find the version you wish to install from our download servers and install it as you would any other package. For example:
cd /tmp/
wget https://download.netify.ai/5/debian/10/amd64/netify-proc-core_1.0.58-1_amd64.deb
apt install ./netify-proc-core_1.0.58-1_amd64.deb
OpenWRT
OpenWRT 23.05
Assuming you have installed the Netify repository during the Netify Agent installation, you can install the Netify Core Processor by running:
opkg update
opkg install netify-proc-core
To install a package manually, you can find the version you wish to install from our download servers and install it as you would any other package. For example:
pkg add https://download.netify.ai/5/openwrt/23.05/x86/netify-proc-core_1.0.58-1_x86_64.ipkOpenWRT 22.03
Assuming you have installed the Netify repository during the Netify Agent installation, you can install the Netify Core Processor by running:
opkg update
opkg install netify-proc-core
To install a package manually, you can find the version you wish to install from our download servers and install it as you would any other package. For example:
pkg add https://download.netify.ai/5/openwrt/22.03/x86/netify-proc-core_1.0.58-1_x86_64.ipkOpenWRT 21.02
Assuming you have installed the Netify repository during the Netify Agent installation, you can install the Netify Core Processor by running:
opkg update
opkg install netify-proc-core
To install a package manually, you can find the version you wish to install from our download servers and install it as you would any other package. For example:
pkg add https://download.netify.ai/5/openwrt/21.02/x86/netify-proc-core_1.0.58-1_x86_64.ipkOpenWRT 19.07
Assuming you have installed the Netify repository during the Netify Agent installation, you can install the Netify Core Processor by running:
opkg update
opkg install netify-proc-core
To install a package manually, you can find the version you wish to install from our download servers and install it as you would any other package. For example:
pkg add https://download.netify.ai/5/openwrt/19.07/x86/netify-proc-core_1.0.58-1_x86_64.ipkOPNsense
OPNsense 25.7 - Visionary Viper
Assuming you have installed the Netify repository during the Netify Agent installation, you can install the Netify Core Processor by running:
pkg update
pkg install netify-proc-core
To install a package manually, you can find the version you wish to install from our download servers and install it as you would any other package. For example:
pkg add https://download.netify.ai/5/25.7/amd64/netify-proc-core_1.0.58,1.pkgOPNsense
OPNsense 24.7 - Thriving Tiger
Assuming you have installed the Netify repository during the Netify Agent installation, you can install the Netify Core Processor by running:
pkg update
pkg install netify-proc-core
To install a package manually, you can find the version you wish to install from our download servers and install it as you would any other package. For example:
pkg add https://download.netify.ai/5/24.7/amd64/netify-proc-core_1.0.58,1.pkgOPNsense
OPNsense 24.1 - Savvy Shark
Assuming you have installed the Netify repository during the Netify Agent installation, you can install the Netify Core Processor by running:
pkg update
pkg install netify-proc-core
To install a package manually, you can find the version you wish to install from our download servers and install it as you would any other package. For example:
pkg add https://download.netify.ai/5/24.1/amd64/netify-proc-core_1.0.58,1.pkgOPNsense 23.7 - Restless Roadrunner
Assuming you have installed the Netify repository during the Netify Agent installation, you can install the Netify Core Processor by running:
pkg update
pkg install netify-proc-core
To install a package manually, you can find the version you wish to install from our download servers and install it as you would any other package. For example:
pkg add https://download.netify.ai/5/freebsd/13.2/amd64/netify-proc-core_1.0.58,1.pkgpfSense
pfSense Plus 23.x
Assuming you have installed the Netify repository during the Netify Agent installation, you can install the Netify Core Processor by running:
pkg update
pkg install netify-proc-core
To install a package manually, you can find the version you wish to install from our download servers and install it as you would any other package. For example:
pkg add https://download.netify.ai/5/freebsd/13.2/amd64/netify-proc-core_1.0.58,1.pkgpfSense CE 2.7.x
Assuming you have installed the Netify repository during the Netify Agent installation, you can install the Netify Core Processor by running:
pkg update
pkg install netify-proc-core
To install a package manually, you can find the version you wish to install from our download servers and install it as you would any other package. For example:
pkg add https://download.netify.ai/5/freebsd/13.2/amd64/netify-proc-core_1.0.58,1.pkgRocky Linux
Rocky Linux 9
Assuming you have installed the Netify repository during the Netify Agent installation, you can install the Netify Core Processor by running:
yum update
yum install netify-proc-core
To install a package manually, you can find the version you wish to install from our download servers and install it as you would any other package. For example:
cd /tmp/
wget https://download.netify.ai/5/rockylinux/9/stable/x86_64/netify-proc-core_1.0.58-1.os9.x86_64.rpm
yum install ./netify-proc-core_1.0.58-1.os9.x86_64.rpm
Rocky Linux 8
Assuming you have installed the Netify repository during the Netify Agent installation, you can install the Netify Core Processor by running:
yum update
yum install netify-proc-core
To install a package manually, you can find the version you wish to install from our download servers and install it as you would any other package. For example:
cd /tmp/
wget https://download.netify.ai/5/rockylinux/8/stable/x86_64/netify-proc-core_1.0.58-1.os8.x86_64.rpm
yum install ./netify-proc-core_1.0.58-1.os8.x86_64.rpm
openSUSE Linux
openSUSE Leap 15.5
Assuming you have installed the Netify repository during the Netify Agent installation, you can install the Netify Core Processor by running:
zypper update
zypper install netify-proc-core
To install a package manually, you can find the version you wish to install from our download servers and install it as you would any other package. For example:
cd /tmp/
wget https://download.netify.ai/5/opensuse/15.5/stable/x86_64/netify-proc-core_1.0.58-1.os15.5.x86_64.rpm
zypper install ./netify-proc-core_1.0.58-1.os15.5.x86_64.rpm
Ubuntu
Ubuntu 24.04 - Noble
Assuming you have installed the Netify repository during the Netify Agent installation, you can install the Netify Core Processor by running:
apt update
apt install netify-proc-core
To install a package manually, you can find the version you wish to install from our download servers and install it as you would any other package. For example:
cd /tmp/
wget https://download.netify.ai/5/ubuntu/noble/binary-amd64/netify-proc-core_1.0.58-1_amd64.deb
apt install ./netify-proc-core_1.0.58-1_amd64.deb
Ubuntu 22.04 - Jammy
Assuming you have installed the Netify repository during the Netify Agent installation, you can install the Netify Core Processor by running:
apt update
apt install netify-proc-core
To install a package manually, you can find the version you wish to install from our download servers and install it as you would any other package. For example:
cd /tmp/
wget https://download.netify.ai/5/ubuntu/jammy/binary-amd64/netify-proc-core_1.0.58-1_amd64.deb
apt install ./netify-proc-core_1.0.58-1_amd64.deb
Ubuntu 20.04 - Focal
Assuming you have installed the Netify repository during the Netify Agent installation, you can install the Netify Core Processor by running:
apt update
apt install netify-proc-core
To install a package manually, you can find the version you wish to install from our download servers and install it as you would any other package. For example:
cd /tmp/
wget https://download.netify.ai/5/ubuntu/focal/binary-amd64/netify-proc-core_1.0.58-1_amd64.deb
apt install ./netify-proc-core_1.0.58-1_amd64.deb
Configuration
Plugin Loader Configuration
All plugins are disabled by default, and the Netify Core Processor plugin is no different. To enable:
netifyd --enable-plugin proc-coreAlternatively, you can edit /etc/netifyd/plugins.d/10-netify-proc-core.conf and set enable to yes.
# Netify Core Processor Plugin Loader
# Copyright (C) 2023 eGloo Incorporated
#
# This is free software, licensed under the GNU General Public License v3.
#
##############################################################################

[proc-core]
enable = yes
plugin_library = /usr/lib64/libnetify-proc-core.so.0.0.0
conf_filename = ${path_state_persistent}/netify-proc-core.json

# vim: set ft=dosini :
Plugin Configuration
Once the plugin has been enabled, it can be configured using the JSON configuration file specified in the plugin loader configuration. Let's look at a configuration sample to review the syntax and parts of the file.
{
    "format": "json",
    "compressor": "none",
    "sinks": {
        "sink-log": {
            "stats": {
                "enable": true,
                "types": [ "stream-stats" ]
            }
        }
    }
}| Property | format |
|---|---|
| Description | The core processor passes structured data to sink plugins for further handling. This field determines what type of data structure to output. The plugin supports: |
| Type | string |
| Options | json, msgpack |
| Property | compressor |
|---|---|
| Description | If desired, data can be compressed using a compatible library. |
| Type | string |
| Options | none, gzip |
| Property | sinks |
|---|---|
| Description | An object array that determines which Netify sink plugins to send data to. |
| Type | object |
| Options | Depends on local configuration (see Sink Objects section below) |
Sink Objects
The Core Processor's sink object list determines which sinks receive the core processor's data and what type of data should be sent to it. A single core processor can be configured to send to any number of sinks. In the example above, we are sending to only one, the sink-log. Let's take a closer look at the configuration.
The sink-log object key is critical - it must match the section name of the corresponding plugin loader. The nested key inside the sink refers
to a channel as defined in the sink plugin. In this example,
the keyed sink-log reference means (very likely) that we have the sink log plugin installed and enabled and
that we find a section named sink-log. We should also see a channel defined in the sink-log plugin with the name stats.
To verify this, we need to first look at the sink log loader configuration file:
$ cat /etc/netifyd/plugins.d/10-netify-sink-log.conf

# Netify Agent Log Sink Plugin Loader
# Copyright (C) 2023 eGloo Incorporated
#
# This is free software, licensed under the GNU General Public License v3.
#
##############################################################################

[sink-log]
enable = yes
plugin_library = /usr/lib64/libnetify-sink-log.so.0.0.0
conf_filename = ${path_state_persistent}/netify-sink-log.json

# vim: set ft=dosini :
You can see the sink-log section name does match our core processor sink target configuration. The fact that the configuration file exists,
is a good indication it has been installed, and the enable = yes confirms the plugin is enabled. From this file, we can also see the
JSON configuration file of the sink log from the conf_filename option.
Next, we look at the JSON configuration file for the sink-log plugin.
$ cat /etc/netifyd/netify-sink-log.json

{
    "overwrite": false,
    "log_path": "/tmp",
    "channels": {
        "stats": {
            "overwrite": true,
            "log_path": "/tmp",
            "log_name": "netify-stats-log-"
        }
    }
}
As seen above, the stats channel exists. To further gain an understanding of the sink log configuration, please
go here.
Output Format
There are several different types of data available via the Netify Agent JSON encoded data streams:
- Flow - Flow detection and risk metadata
- Flow Purge - Flow purge and performance data
- Flow Stats - Flow stats time-based data
- Interfaces - Network interface information with associated MACs and IPs
- Interface Stats - Network interface stats
- Endpoints - MACs and IP addresses detected on the network
- Agent Hello - Agent startup information
- Agent Status - Agent information: memory, cache info, and summary stats
Information on each type of data is described below. The structures should be self-documenting, but if further explanation or details are required, please don't hesitate to contact us.
Type: Flow - Detection
Description
Detection data is available as soon as the first 1 to 32 packets of a network conversation have been completed. This data provides a path to quickly react to network traffic patterns on the network. It also provides the network metadata extracted from the deep packet inspection engine.
Let's take a look at some sample data (see adjacent JSON data). This particular flow comes from a mobile phone that started up the WhatsApp app. You can see the usual network data in the JSON structure: IP version, MAC addresses, IPs, ports, network interfaces, and timestamps. In addition, you can see the additional DPI data.
category
The application, domain and protocol categories are given in the flow data. In this example, the application category is "Social Media" (#24) and the protocol category is "Web" (#22).
conntrack
Provides the conntrack ID of the flow in the connection tracking table, marks and source/destination IP and ports.
detected_application / detected_application_name
The detected_application_name shows that it was a flow generated by GooglePlay. In this particular case, this detection was made using the TLS/SSL SNI hostname and certificate common name. Other heuristics are also used to detect applications.
detected_protocol / detected_protocol_name
The DPI engine detected the QUIC protocol (detected_protocol). This is more than just mapping port 443 to QUIC, the engine did a full deep packet inspection and used the Application-Layer Protocol Negotiation (ALPN) data to fine-tune detections. In fact, Netify will detect SSL/SNI over any port.
detection_guessed
A boolean flag indicating whether the protocol was successfully dissected or guessed.
detection_packets
The number of packets used to complete the protocol classification.
detection_updated
A boolean flag indicating whether, with more packets, the protocol dissection was updated from the initial classification.
dhc_hit
Domain Hint Cache was used to assist application classification.
digest
A unique ID for the duration of the flow..
digest_prev
As protocol dissection and classification occurs, these are sibling digests to the flow tracking digest. This field is only used internally and with Netify Informatics.
dns_host_name
Hostname associated with a corresponding DNS query.
first_seen_at
Timestamp when the flow was first seen.
host_server_name
Hostname extracted from metadata specific to the protocol. For example, TLS uses the SNI, HTTP uses the Host from the header etc.
ip_dscp
DSCP mark integer.
ip_nat
A boolean flag denoting whether the packet was NATed.
ip_protocol
The IP protocol - see Wikipedia.
ip_version
Indicates IPv4 (4) or IPv6 (6).
last_seen_at
Timestamp when the flow was last seen.
ip_version
Indicates IPv4 (4) or IPv6 (6).
Other/Local Nomenclature
The local designation indicates the endpoint's local side, and the other designation will be indicated by the other_type field. These designations do not indicate a flow's direction. To determine which side of a flow started the conversation, consult the local_origin field. When this field is true, it indicates that the local endpoint started transmitting first. When false, the opposite endpoint started the flow.
In the stats data (see below) and referencing the example to the right, we see:
"local_origin": true
"local_ip": "192.168.71.173",
"local_bytes": 10076,
"other_type": "remote",
"other_ip": "142.251.32.110",
"other_bytes": 5405
In this example, 192.168.71.173 transmitted 10076 bytes and received 5405 bytes from 142.251.32.110. The flow originated from 192.168.71.173.
Said another way, 192.168.71.173 uploaded 10076 bytes and downloaded 5405 bytes from 142.251.32.110.
risks
Any flows that trigger a risk event will have details provided in the risk section of the metadata.
soft_dissector
A boolean flag indicating a soft dissector in the application signature list was used to help classify flow.
soft_dissector
A boolean flag indicating a soft dissector in the application signature list was used to help classify flow.
ssl
Detecting the protocol is just the start. The Netify Agent also breaks down the details of the SSL/TLS connection:
- SNI hostname: play.google.com
- Certificate CN: *.google.com
- TLS version: 0x0303 (TLS 1.2)
- Encryption cipher: 0xc02b info
- JA4 Client Fingerprint: details
- Subject DN
Other protocols will have different metadata attached. For example, HTTP traffic also includes the URL and user agent.
total_bytes
Total bytes.
total_packets
Total packets.
vlan_id
Extracted VLAN ID.
{
    "category": {
        "application": 31,
        "domain": 0,
        "network": 0,
        "protocol": 22
    },
    "conntrack": {
        "id": 846434825,
        "mark": 0,
        "reply_dst_ip": "192.168.71.173",
        "reply_dst_port": 34419,
        "reply_src_ip": "142.251.32.110",
        "reply_src_port": 443
    },
    "detected_application": 10909,
    "detected_application_name": "netify.google-play",
    "detected_protocol": 188,
    "detected_protocol_name": "QUIC",
    "detection_guessed": false,
    "detection_packets": 2,
    "detection_updated": true,
    "dhc_hit": false,
    "digest": "5ce05e8aca3dc92a075749fc0b88cf41af92f968",
    "digest_prev": [
        "8405b3f3ae6de53d73429658935bbe6754bf031b",
        "fff07c44ba08db6bf56d509e338ea745d87b089d"
    ],
    "dns_host_name": "youtube-ui.l.google.com",
    "fhc_hit": false,
    "first_seen_at": 1748887982795,
    "host_server_name": "play.google.com",
    "ip_dscp": 0,
    "ip_nat": false,
    "ip_protocol": 17,
    "ip_version": 4,
    "last_seen_at": 1748887983053,
    "local_bytes": 10076,
    "local_ip": "192.168.71.173",
    "local_mac": "00:00:00:00:00:00",
    "local_origin": true,
    "local_packets": 13,
    "local_port": 34419,
    "local_rate": 10076.0,
    "other_bytes": 5405,
    "other_ip": "142.251.32.110",
    "other_mac": "e0:63:da:5a:a5:de",
    "other_packets": 15,
    "other_port": 443,
    "other_rate": 2702.5,
    "other_type": "remote",
    "risks": {
        "ndpi_risk_score": 110,
        "ndpi_risk_score_client": 95,
        "ndpi_risk_score_server": 15,
        "risks": [
            39,
            46
        ]
    },
    "soft_dissector": false,
    "ssl": {
        "alpn": [
            "h3"
        ],
        "cipher_suite": "0x0000",
        "client_sni": "play.google.com",
        "encrypted_ch_version": "0xfe0d",
        "version": "0x0304"
    },
    "total_bytes": 15481,
    "total_packets": 28,
    "vlan_id": 0
}
Type: Flow Purge - Stats and Performance Data
Description
When a network flow is either closed or becomes idle, the Netify Agent publishes a flow_purge record to the Data Stream. Today, this stream provides network statistics: byte counters, traffic counters, timestamps, etc. In the near future, expect to see performance information added to the payload, for example:
- Statistics on DNS response times
- HTTP response codes and times
- Network performance statistics
- and more
Example Use Cases
- Cybersecurity analysis
- Policy and Charging Rules Function (PCRF)
- Zero-rating policy engines
"type": "flow_purge"
"reason": "expired",
"flow": {
  "digest": "178bf5650a79d5e8ddc6a988d0c02b3d799180d0",
  "last_seen_at": 1606232131756,
  "local_bytes": 2434,
  "local_packets": 21,
  "other_bytes": 6139,
  "other_packets": 16,
  "total_bytes": 8573,
  "total_packets": 37,
  "detection_packets": 3,
  ... snip ...
Type: Flow Stats - Stats Information
Description
Some network flows are long-lived, for example, audio/video streams and VPN connections. The Netify Agent will periodically publish a flow_stats record to the Data Stream. The network status on active flows provides real-time insights into the network.
Example Use Cases
- Live bandwidth statistics
- QoE based on live data usage
"type": "flow_stats",
"flow": {
  "digest": "178bf5650a79d5e8ddc6a988d0c02b3d799180d0",
  "last_seen_at": 1606232131756,
  "local_bytes": 2434,
  "local_packets": 21,
  "other_bytes": 6139,
  "other_packets": 16,
  "total_bytes": 8573,
  "total_packets": 37
},
Type: Interfaces
The interfaces data type provides the MAC address and associated IPs for the given network interface.
"type": "interfaces",
"eth0": {
  "mac": "02:42:ac:11:00:02",
  "role": "LAN"
  "capture_type": "PCAP",
  "addr": [
    "fe80::42:acff:fe11:2",
    "fd20:c0:ca67::242:ac11:2",
    "172.17.0.2"
  ],
}
Type: Interface Stats
The interface_stats data type provides various statistics on the performance of the underlying network interface.
"type": "interface_stats",
"eth0": {
  "capture_dropped": 0,
  "capture_filtered": 0,
  "discarded": 0,
  "discarded_bytes": 0,
  "ethernet": 7,
  "flow_dropped": 0,
  "fragmented": 0,
  "icmp": 0,
  "igmp": 0,
  "ip": 7,
  "ip_bytes": 918,
  "largest_bytes": 215,
  "mpls": 0,
  "pppoe": 0,
  "queue_dropped": 0,
  "raw": 7,
  "tcp": 0,
  "tcp_resets": 0,
  "tcp_seq_errors": 0,
  "udp": 7,
  "vlan": 0,
  "wire_bytes": 1086
},
Type: Endpoints
The endpoints data type provides the MAC address and associated IPs for detected systems on the network.
"type": "endpoints",
"02:42:3f:e6:a4:ee": [
  "172.17.0.1"
],
Type: Agent Hello
The agent_hello data type provides versioning and feature information.
This makes it possible for third-party applications to manage upgrades and changes
to the Netify Agent data stream.
"type": "agent_hello",
"agent_version": 5.0.1,
"build_version": "Netify Agent/5.0.1 (debian; x86_64; ...)",
"json_version": 1.9
Type: Agent Status
The agent_status data type provides agent information, including
memory usage, cache sizes and more.
"type": "agent_status",
"cpu_cores": 8,
"cpu_system": 0.157047,
"cpu_system_prev": 0.151123,
"cpu_user": 0.088339,
"cpu_user_prev": 0.086594,
"dhc_size": 0,
"dhc_status": true,
"flow_count": 7,
"flow_count_prev": 7,
"flows_active": 1,
"flows_expired": 0,
"flows_expiring": 0,
"flows_in_use": 1,
"flows_purged": 0,
"maxrss_kb": 28324,
"maxrss_kb_prev": 28324,
"tcm_kb": 9077,
"tcm_kb_prev": 9100,
"timestamp": 1697557964,
"update_imf": 1,
"update_interval": 15,
"uptime": 450
Examples
Netify Informatics
The agent_hello data type provides versioning and feature information. This makes it possible for third-party applications to manage upgrades and changes to the Netify Agent data stream.
"type": "agent_hello",
"agent_version": 5.0.1,
"build_version": "Netify Agent/5.0.1 (debian; x86_64; ...)",
"json_version": 1.9The agent_status data type provides agent information, including memory usage, cache sizes and more.
"type": "agent_status",
"cpu_cores": 8,
"cpu_system": 0.157047,
"cpu_system_prev": 0.151123,
"cpu_user": 0.088339,
"cpu_user_prev": 0.086594,
"dhc_size": 0,
"dhc_status": true,
"flow_count": 7,
"flow_count_prev": 7,
"flows_active": 1,
"flows_expired": 0,
"flows_expiring": 0,
"flows_in_use": 1,
"flows_purged": 0,
"maxrss_kb": 28324,
"maxrss_kb_prev": 28324,
"tcm_kb": 9077,
"tcm_kb_prev": 9100,
"timestamp": 1697557964,
"update_imf": 1,
"update_interval": 15,
"uptime": 450Examples
Netify Informatics
Minimal configuration to enable Netify Informatics Cloud Network Intelligence service.
The data would be sent to an HTTP sink channel named legacy.
{
    "format": "json",
    "compressor": "none",
    "sinks": {
        "sink-http": {
            "legacy": {
                "enable": true,
                "types": [ "legacy-http" ],
                "format": "json",
                "compressor": "gz"
            }
        }
    }
}Send flow and stats data to the Sink Socket plugin.
Send uncompressed flow and stats data from real-time flows to the Sink Socket plugin to a channel name flows.
{
    "format": "json",
    "compressor": "none",
    "sinks": {
        "sink-socket": {
            "flows": {
                "enable": true,
                "types": [ "stream-flows", "stream-stats" ],
                "format": "json",
                "compressor": "none"
            }
        }
    }
}Send flow and stats data to the Sink Message Queue plugin.
Send data compressed with gzip and formatted using Message Pack to the Sink Message Queue plugin to a channel name data-center-1.
{
    "format": "json",
    "compressor": "none",
    "sinks": {
        "sink-mqtt": {
            "data-center-1": {
                "enable": true,
                "types": [ "stream-flows", "stream-stats" ],
                "format": "msgpack",
                "compressor": "none"
            }
        }
    }
}