Netify DPI - Bandwidth and KPIs
The Netify Agent continuously collects and aggregates deep packet inspection telemetry into bandwidth and key performance indicator (KPI) datasets that are ready for operations, analytics, and reporting.
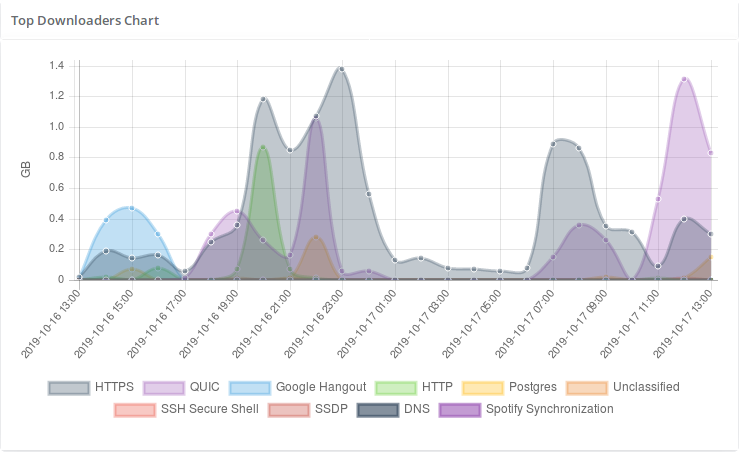
With this aggregation pipeline, teams can analyze bandwidth consumption by application, protocol, and other DPI attributes such as category, destination context, security posture, and flow behavior. This creates a clear, high-fidelity view of what is driving traffic on the network.
Aggregated Data
Aggregated telemetry makes it easy to move from raw packet data to meaningful bandwidth intelligence.
Netify also publishes KPI signals for network performance and risk analysis, including error trends, reset behavior, and anomalous traffic patterns that can indicate service issues or security events.
Whether you are planning capacity, validating QoS policy outcomes, or investigating suspicious traffic spikes, Netify's aggregated DPI telemetry provides the bandwidth context needed to make faster and more accurate decisions.
Technical Details
For implementation details, review the Netify Agent v5 telemetry formats documentation, with a focus on flow stats and aggregator telemetry. These streams provide the summarized bandwidth and KPI data used to report usage by application, protocol, and other DPI attributes.